Reading the Site Structure Visualization
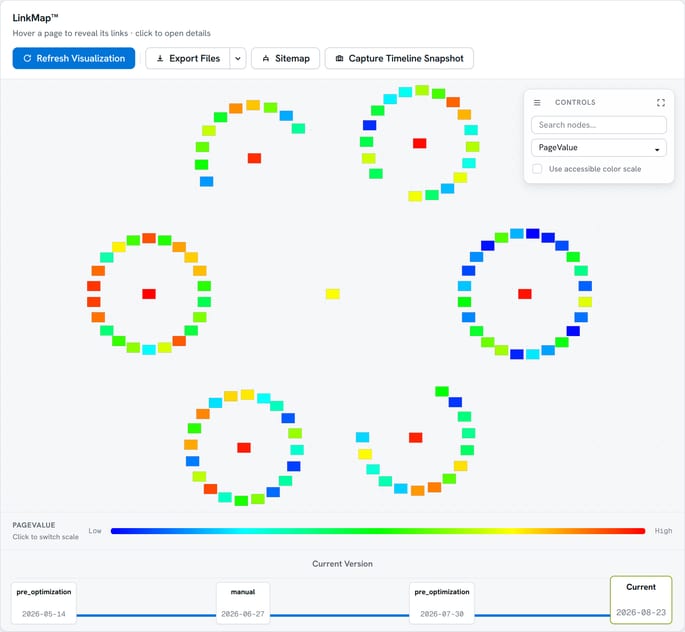
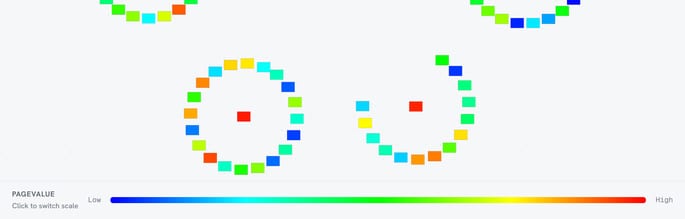
Every page on your site is a node, and the node's color is its PageValue, a PageRank-style score measured against your other pages. Red is the top of your scale, blue the bottom, running through cyan, green and yellow between them.
That scale is internal. It says which of your pages carry weight, not how you compare to anyone else. The rest of this page covers what you can do with the map once you can read it, and you can send the result to clients through a share link, with the SEO Report Builder on the same link, or why visualizing structure works at all.
Getting Started with the Visualization
The map lays itself out from two things at once: how many clicks a page sits from your homepage, and how topically close it is to its neighbours. That is why related pages end up near each other rather than in the order you crawled them.
Understanding the Display
Four things on a node carry meaning, and none of them are decoration. Color is PageValue relative to your own site, blue at the bottom of the scale through to red at the top. Bigger text means the page sits higher in your site hierarchy. A solid border is a page that exists, and a dashed border is one you have planned but not built.
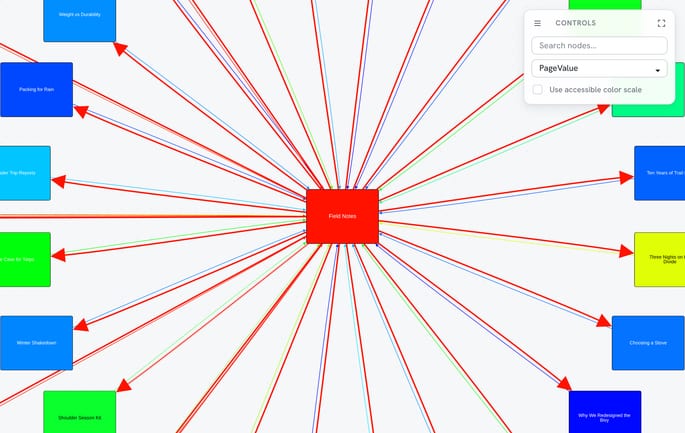
The lines follow the same rule: solid for links that exist, dashed for planned relationships. Node text flips between black and white to stay readable on whatever color the node is.
It is normal, even expected, that your pages span the whole color range. The scale compares your pages to your own pages. The value is not from Google and does not compare your site to any other site on the internet, and what it shows is which of your pages could benefit most from optimization.
Interactive Controls
Moving Around the Map
Drag the background to pan. Use the mouse wheel or a pinch gesture to zoom. The Refresh button resets the view when you have moved too far to find your way back.
HUD (Heads-Up Display)
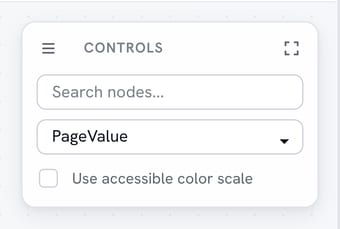
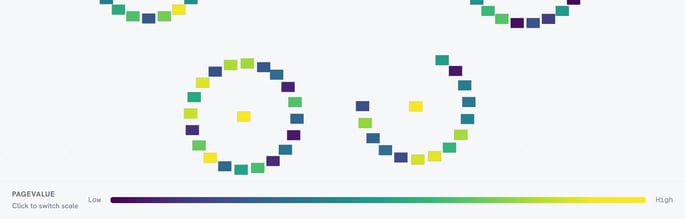
The HUD sits in the top-right corner and holds four controls. The search box finds a page by any part of its URL or title and hides the rest. The metric selector chooses what node color means, PageValue by default. The fullscreen toggle gives the map the whole screen, and the accessibility toggle swaps the color scale for a color-blind friendly one.
Timeline Controls
The timeline appears below the visualization once a snapshot exists. Click any point on it to load that snapshot, hover a marker to see its details, and note that the rightmost position is always current data. A pre-optimization snapshot is taken automatically before changes are applied, which is what gives you a before and after to show.
You can share these timeline views with clients, and set reminders against them with calendar and tasks.

Interacting with Pages
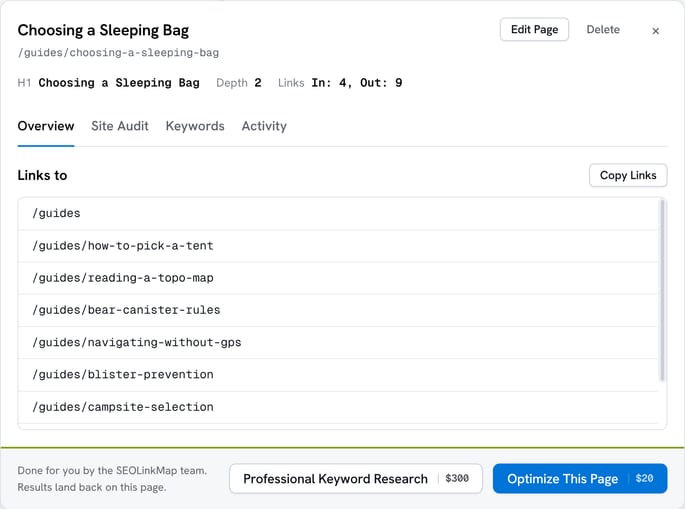
Click any page to open its panel. It shows the URL, title and H1, the page's depth and link counts, the pages it links to, its keywords, the audit issues on it, and the SEO actions and backlinks logged against it, with Edit Page, Add SEO Action, Add Backlink and keyword research one click away. Relationships and keywords are edited on their own tabs.
Working with Relationships
The visualization makes it easy to understand and modify relationships between pages. When you hover over a page, its connections are highlighted, showing both inbound and outbound relationships.
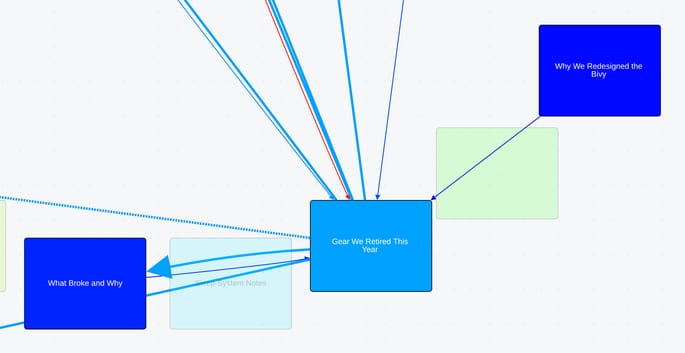
To create new relationships:
- Click the left edge of the source node to start a link
- Click the left edge of the target node
- Confirm the connection in the dialog that appears
Visualization Tools
Export Options
Export the map as a PNG for a high-quality image, a JPG for a smaller file, or JSON for a data backup. A Sitemap button beside it downloads an XML sitemap built from the pages on the map.
Color Schemes
The color legend runs beneath the map. Use the HUD toggle to switch between the standard scale and a colorblind-friendly Viridis palette that runs dark to bright instead of blue to red.
Advanced Features
As you become comfortable with the basic visualization, explore advanced features like SEO Workflows, authority flow analysis, and structural optimization. These tools help identify opportunities to improve your site's structure and performance.
Ready to take your optimization further? Learn about our automated optimization strategies for targeted page improvements.
What Does the Math Say
About Your Site?
Finding out is free and takes minutes.