LinkMap Best Practices Guide
The map is not one picture of your site. It redraws for every metric you color it by, and picking the right one is the decision that makes it useful.
The rest of this page is the handful of habits that save rework: what to separate, what to capture before you change anything, and what each export actually contains. See successful workflows for the longer sequences these fit into.
Keep Projects Separate
One project per domain. A project crawls the domain it was created for and ignores every link off it, so a second site needs its own project to be mapped at all.
Create them from the project management interface. Separate projects also keep share links separate, which matters the moment a client asks for one.
Color By The Right Metric
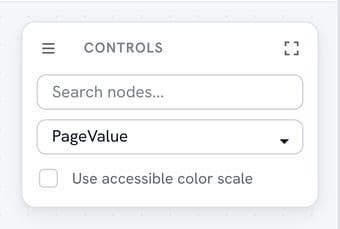
The HUD selector recolors every node by the metric you pick. The list covers structural measurements taken from your own site, Search Console figures, Analytics figures, and combined scores built from several of those at once.
Structural is what you always have -- PageValue, internal links in and out. Search Console adds impressions, clicks, average position, best position and the indexing gap. Analytics adds pageviews, active users, engagement rate and session duration. Combined scores such as Search Performance, Content Effectiveness and Visibility sit on top. Only metrics you have data for appear, so connecting Search Console and Analytics grows the list; PageValue is the default either way.
That is the real habit: pick the metric that matches the question. Coloring by PageValue answers where your own links point. Coloring by impressions answers where Google already sends people, and the pages bright on one and dark on the other are the whole job.
The selector is a window onto a much larger set. 200+ measurements are taken on every page you own: performance, content, headings, links, media, structured data, trust and authority. The premium tools take all of them again on the pages outranking you.
Next to it, "Use accessible color scale" swaps the default heatmap for a viridis scale that stays readable with color vision deficiency. The interactive visualization guide covers the rest of the controls.
Find Pages With HUD Search
On a site with hundreds of nodes, the HUD search box finds a page faster than hunting for it. Type part of a URL or title.
Dragging nodes around is fine for looking at something, but the arrangement is not saved. Layout is computed during the crawl, so the map returns to it next time you open the project.
Frame Exports Before Taking Them
PNG and JPG capture the current viewport at twice screen resolution, not the whole map. Whatever is off screen is not in the file, so zoom and pan to the framing you want first.
PNG exports on a white background. Neither format gives you transparency, so plan on placing it against white in a deck.
JSON is the exception: it contains the whole graph, every node and edge with its data, which is what you want for a backup or for analysis elsewhere. All three download as site-structure with the matching extension. The export options page covers each format in detail.
Snapshot Before Every Change
Take a manual snapshot before you touch anything. It is the only way to get a real before-and-after, and it costs one click made at the right moment.
The timeline shows each snapshot by date, so note what you changed and when in the project chat or your own task list. A snapshot taken the day before a move is the one you will want to compare against a month later.

Pick One Optimization Strategy
Start with the balanced optimization strategy, which reads the whole site rather than one goal.
Move to a targeted strategy once you know what you are fixing: authority focus to move equity, content relevance to tighten topical signals, or structural to change the shape of the site.
Professional keyword research is the separate track, for new content rather than existing pages.
Share With A Deliberate Expiry
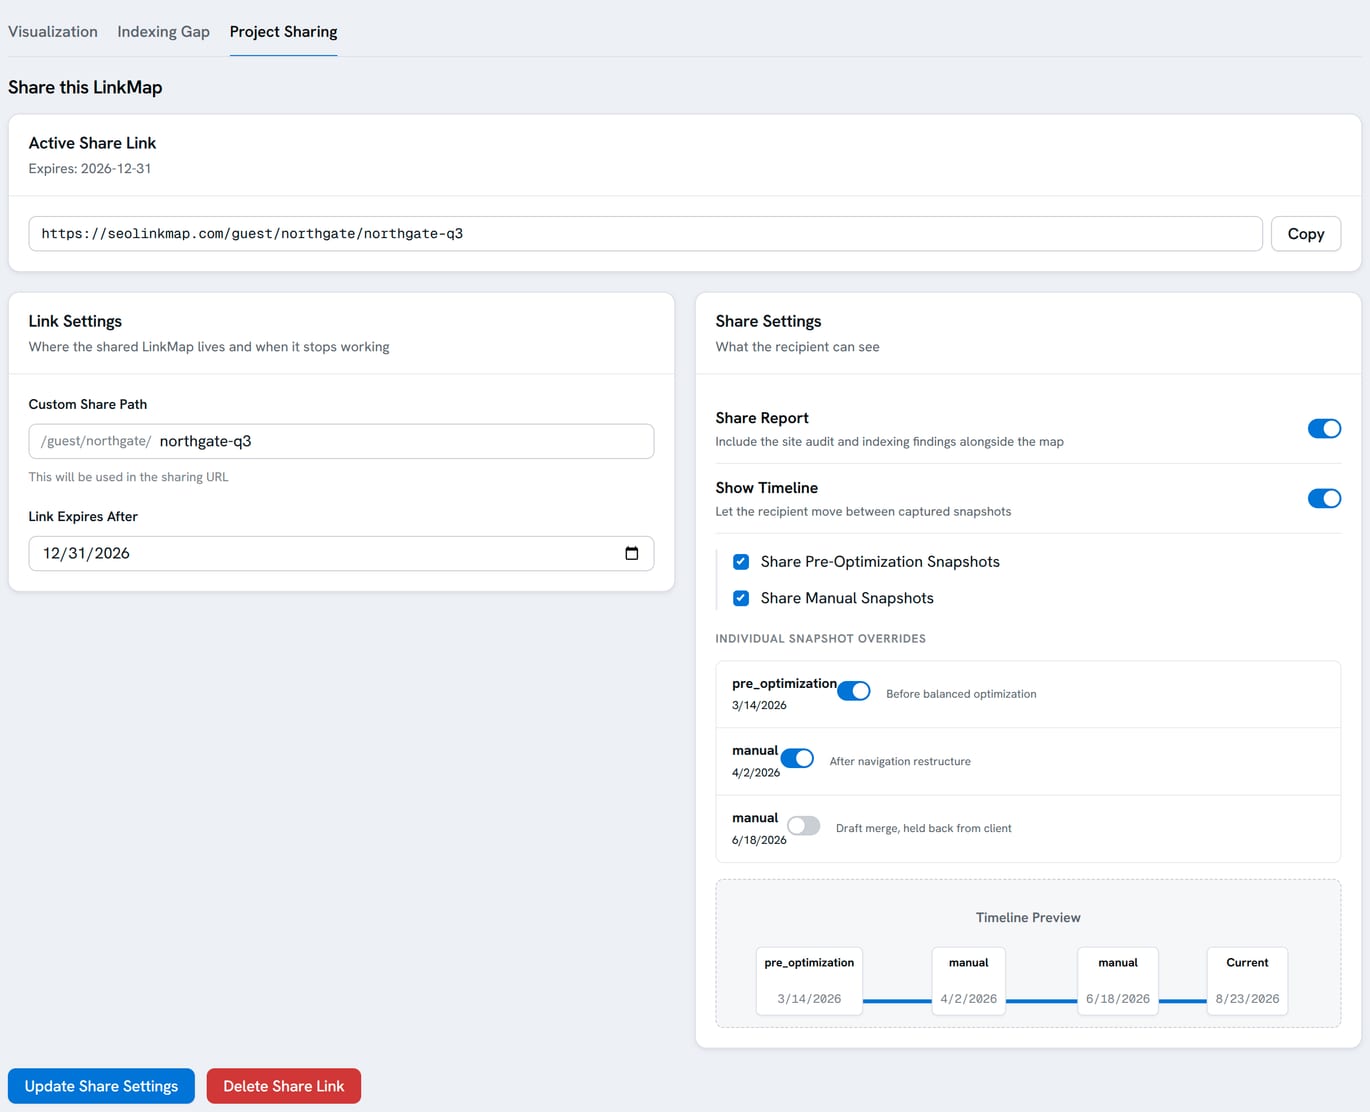
The expiry date on a share link defaults to thirty days out. That suits a review cycle and not much else, so set it against the engagement rather than accepting it.
The client opens the map at the crawl layout, so use the project sharing system to decide whether the audit report and the timeline travel with it, and tell them which page to search for first. A client who lands on their own problem page starts a different conversation than one who starts at the homepage.
When the deliverable is a report rather than a map, the Report Builder rides the same share link and gives you pages to lay the findings out on.
Pro Tip
Color by Indexing Gap before a client call. Pages Google has not indexed are the shortest explanation of why traffic is flat, and they read off the map without a single number being quoted.
The analysis tools documentation goes deeper on reading what the map shows once these habits are in place.
What Does the Math Say
About Your Site?
Finding out is free and takes minutes.